Source: http://www.softwareishard.com/blog/firebug/firebug-net-panel-timings/
I have recently got several questions about how to understand the timing numbers provided by the Net panel in Firebug and so, I decided to write a quick summary explaining what everything is the Net panel actually measuring (in terms of time).
Just to note that there is already a post, I wrote a while ago, summarizing all other features of the Net panel using bunch of screen-shots.
This post is dedicated only to timings as it’s being implemented in Firebug 1.5.3.
Basic Timing Data
Let’s start with a basic screenshot of the Net panel, showing 5 requests made when google.com page is loaded.
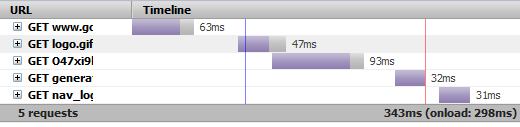
You can read following information:
- The time elapsed since the start of the first request till the end of the last request is 343ms.
- The time elapsed since the start of the first request till the load event fired by the page is 298ms
- The first request has been completed in 63ms, the second in 47ms, etc.
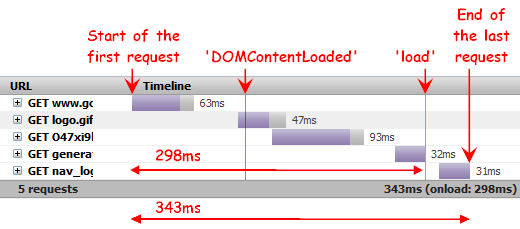
As you can see, there are two numbers (298ms & 343ms) representing two different approaches how to measure the page load time. It depends on a given page and mainly on you, which number is actually more important. Even if the loadevent is fired, there can be number of consequent XHRs that can extend (or not if properly implemented) the real time the user needs to wait before the page is usable.
Advanced Timing Data
Further timing data are displayed for each request using a tooltip. Following screenshot shows a tooltip displayed for the second request in our example.
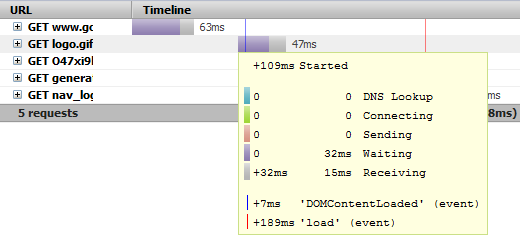
In this case you can see following:
- The second request started 109ms after the start of the first request (since the beginning of the waterfall graph).
- There are two numbers for each request phase (5 phases). The first number on the left says when the phase started within the request. The second number on the right (closer to the phase label) says the time needed to complete each phase. In this case, the first three phases took zero time, and so the Waiting phase was the first real and it needed 32ms to complete. The Receiving phase started in 32nd ms of the request and needed 15ms to complete
- DOMContenLoaded event was fired 7ms after this request started. If this number is negative the event was fired before the request is started.
- load event was fired 189ms after this request started. If this number is negative the event was fired before the request is started.
Here are some notes about each request phase.
- DNS Lookup: DNS resolution time
- Connecting: Elapsed time required to create a TCP connection.
- Blocking (not on the screenshot): Elapsed time spent in a browser queue waiting for a network connection. Displayed only in the case where this situation happens (see also this post).
- Sending: Time needed to send request data to the server.
- Waiting: Waiting for the response (till the first byte is received from the server).
- Receiving: Time necessary to download response body.
Waterfall Graph Time Extent
The last thing I would like to explain is related to the way how requests are graphically represented in time using the waterfall graph.
See the following example:
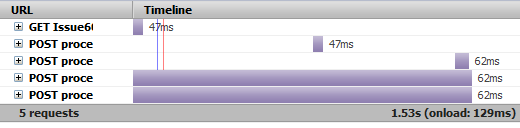
In this scenario, the page executed 5 requests.
- Request for the page
- XHR POST that start within 1s after the previous finishes.
- XHR POST that start within 1s after the previous finishes.
- XHR POST that starts after 1s since the previous finishes.
- XHR POST that starts after 1s since the previous finishes.
In order to keep the X axis (time) in sensible extent, the waterfall graph breaks the time and starts displaying new requests that start later (in the page life) again from the beginning.
In other words, the request that starts after predefined period of time (1s by default) since the previous request finished, starts from 0 time of the graph again. This avoids endless extension of the X axis, which would make the graph less readable.
See how the same scenario is represented on the graph if this breaking time logic would be switched off.
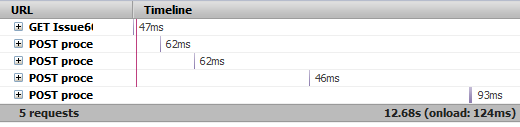
Since the X axis represents now around 12-13s, all requests appear so small that it’s not possible to distinguish theirs phases and also DOMContentLoaded and loadevents (the blue and red vertical lines) are now overlapping (it’s purple now). The graph precision is much smaller now (the same graph-pixels-width represent much longer time).
Finally, there is a preference extensions.firebug.netPhaseInterval [ms] that allows to set the gap after the time break should happen (set to 1000 by default). If set to 0, breaking doesn’t happen at all.
OK, that’s all. I think, sometimes it can be hard to get used to read the graph, so if you have any ideas how to improve it, please me know! ![]()