If you’ve ever logged into the admin page of a 5G router — the box that takes a SIM card and gives you Wi-Fi, usually called a CPE (Customer Premises Equipment) — you’ve probably seen a screen full of acronyms and negative numbers and wondered whether any of it was good news. RSRP, RSRQ, SINR, RSSI: four cryptic values that decide whether your connection flies or crawls. This post walks through a real CPE home screen and explains exactly what each number means, what a healthy value looks like, and how to use them to place your router in the best possible spot.
What you’re actually looking at
The home screen of a CPE typically shows three things: the type of connection, how much data has passed through, and the radio signal quality. Here’s the real example we’ll decode throughout this post:
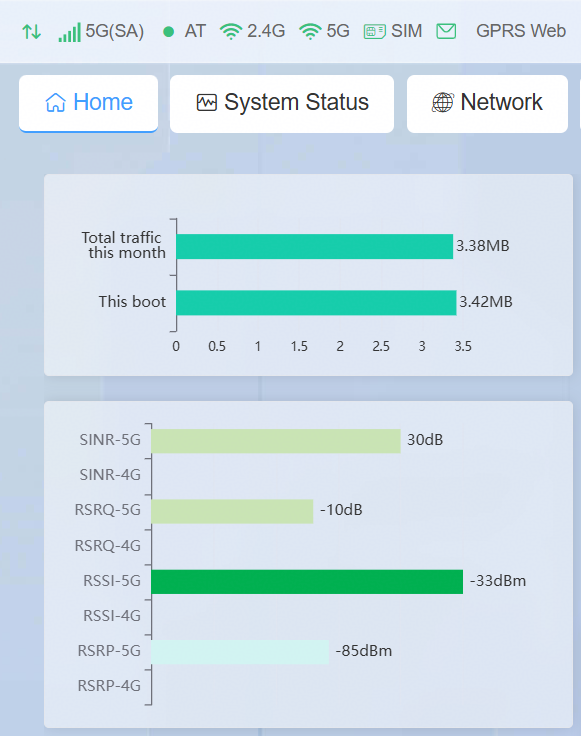
The status bar at the top reads 5G(SA) — and that first detail matters more than it looks. SA stands for Standalone. It means the router is connected directly to a 5G core network, with no 4G LTE involved. The alternative, NSA (Non-Standalone), uses a 4G connection as an „anchor“ and bolts 5G on top for extra speed. Standalone 5G generally means lower latency and a purer 5G experience. This one small label is why, later on the screen, all the 4G signal rows are empty — there simply is no 4G leg to measure.
The traffic counters
Near the top you’ll usually find two data counters. In our example:
- Total traffic this month — cumulative data used in the current billing/calendar month. Useful for keeping an eye on a data cap.
- This boot — data used since the router was last powered on or restarted. This resets to zero every reboot.
Our screen shows only a few megabytes on each, which tells us the device was freshly set up or recently reset. (A quirk worth knowing: the „this boot“ figure can sometimes read slightly higher than „this month“ — that just means the monthly counter rolled over to zero more recently than the last reboot. It’s not an error.)
The four signal metrics that actually matter
This is the part people find confusing, so let’s take it one metric at a time. All of them are measured in decibels, and — importantly — numbers closer to zero are stronger. A value of −85 is better than −100.
RSRP — Reference Signal Received Power (dBm)
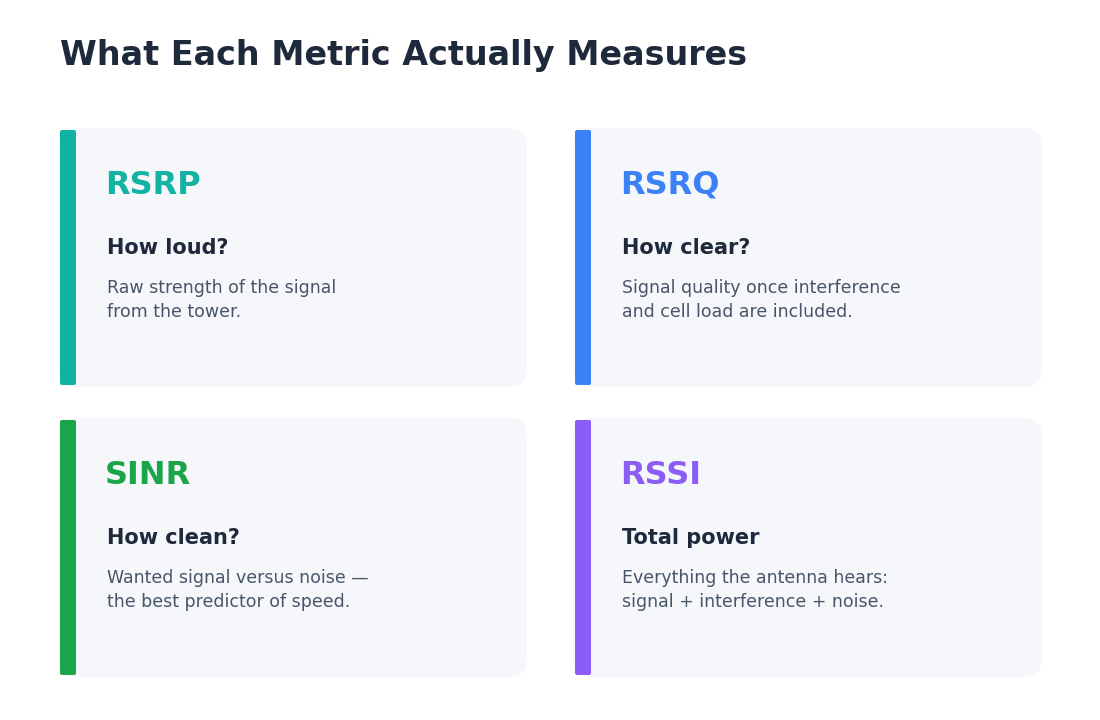
This is the headline number: the raw strength of the signal your router is receiving from the cell tower. Think of it as how loud the tower sounds from where you’re sitting. It’s the single best indicator of coverage. If RSRP is weak, nothing else can save you.
RSRQ — Reference Signal Received Quality (dB)
Where RSRP is about loudness, RSRQ is about clarity relative to everything else on the channel. It factors in interference and how busy the cell is. You can have strong RSRP but poor RSRQ if the tower is congested or there’s a lot of interference — like a loud voice in a crowded, echoey room.
SINR — Signal to Interference plus Noise Ratio (dB)
SINR is arguably the best predictor of real-world speed. It measures how far the wanted signal stands above the background of noise and interference. High SINR means the modem can use faster, denser data encoding, so throughput climbs. Unlike the others, higher positive numbers are what you want here.
RSSI — Received Signal Strength Indicator (dBm)
RSSI is the total power the antenna picks up across the whole band — the wanted signal plus interference plus noise, all lumped together. Because it mixes everything, it’s the least diagnostic of the four on its own. A strong RSSI is reassuring, but it doesn’t tell you how much of that power is actually useful signal. Always read it alongside RSRP and SINR.
Quick reference: what counts as good?
| Metric | Excellent | Good | Fair (cell edge) | Poor |
|---|---|---|---|---|
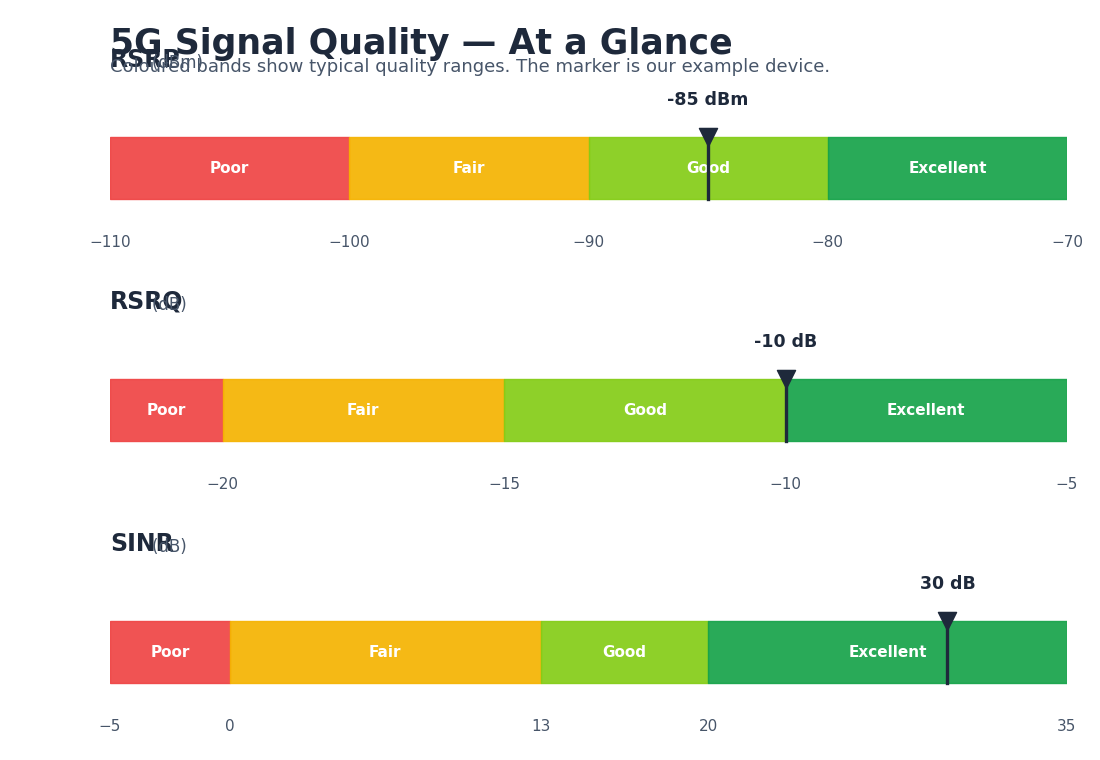
| RSRP (dBm) | ≥ −80 | −80 to −90 | −90 to −100 | ≤ −100 |
| RSRQ (dB) | ≥ −10 | −10 to −15 | −15 to −20 | ≤ −20 |
| SINR (dB) | ≥ 20 | 13 to 20 | 0 to 13 | < 0 |
| RSSI (dBm) | Higher (closer to 0) is stronger; read in context with RSRP/SINR rather than alone | |||
Reading our example device
Putting the numbers from our screen against that table:
- RSRP −85 dBm — solidly in the „good“ band. A dependable, usable signal.
- RSRQ −10 dB — sitting right at the top of the range. The channel is clean and not heavily congested.
- SINR 30 dB — excellent, and close to ideal. This is the number that promises fast speeds.
- RSSI −33 dBm — reads very strong. With a nearby cell and 5G’s wide bandwidth (often aggregated across several carriers), a high RSSI like this is normal and nothing to worry about.
The verdict: this is a healthy, well-positioned link. Good raw strength combined with excellent SINR and quality usually means a clean line of sight to the tower without much congestion — the kind of setup that delivers fast, stable throughput. If you were troubleshooting a slow connection, these are not the numbers you’d blame.
Turning this into better Wi-Fi
The practical payoff of understanding these values is router placement. When you move a CPE around your home, watch RSRP and SINR rather than the bar-graph „signal bars,“ which are far too coarse. A few tips:
- Chase SINR, not just RSRP. A spot with slightly weaker RSRP but much higher SINR will often be faster.
- Height and windows help. Placing the CPE high and near an exterior window facing the tower typically lifts both RSRP and SINR.
- Give small moves time. After repositioning, wait a few seconds for the readings to settle before judging — and note the values before and after so you can compare.
- Poor RSRQ with strong RSRP points to congestion or interference, not a coverage problem — an external antenna won’t fix that as much as a different band or cell would.
Once you can read these four numbers at a glance, a CPE status page stops being a wall of jargon and becomes a genuinely useful diagnostic tool — one that tells you, in seconds, exactly how good your connection is and whether that annoying dead zone is a coverage issue or an interference one.